Getting Started with Leaflet
A tutorial for the Leaflet JS library.
Recently, while working on an assignment for my Urban Science Masters, I came across a wonderful JS library known as Leaflet. Here’s a quickstart guide to using Leaflet, although there are also several tutorials on the site.
While I generally assume that the reader is familiar with basic HTML, CSS and Javascript, working files are provided for the newcomer. The files are all available at the accompany Github repository here. Just follow the instructions on the repo to access the files.
Get that Map
This will follow the 1-basic.html file in the Github repository. Source code here and sample page here
We start with displaying a simple map with Leaflet.
First of all, we need to include the CSS and JS files for Leaflet.
<link rel="stylesheet" href="https://unpkg.com/leaflet@1.3.4/dist/leaflet.css" integrity="sha512-puBpdR0798OZvTTbP4A8Ix/l+A4dHDD0DGqYW6RQ+9jxkRFclaxxQb/SJAWZfWAkuyeQUytO7+7N4QKrDh+drA==" crossorigin=""/>
<script src="https://unpkg.com/leaflet@1.3.4/dist/leaflet.js" integrity="sha512-nMMmRyTVoLYqjP9hrbed9S+FzjZHW5gY1TWCHA5ckwXZBadntCNs8kEqAWdrb9O7rxbCaA4lKTIWjDXZxflOcA==" crossorigin="">
</script>
Then we just define a <div> element that will contain our map:
<div id='map'></div>We will be creating a simple satellite map centered around my current university, Singapore University of Technology and Design. We will also be using the default satellite-streets-v10 style from Mapbox. Check out the the full list of map styles here!
All these details are included using the code below:
// This should be the API key for your account when you sign up with Mapbox
var apiKey = 'pk.eyJ1IjoibWFwYm94IiwiYSI6ImNpejY4NXVycTA2emYycXBndHRqcmZ3N3gifQ.rJcFIG214AriISLbB6B5aw'
// Here we create the map layers - in this case, a satellite layer
var layerIds = [
	'satellite-streets-v10',
]
// This defines where the map is centered when the page is first shown
// NOTE! The coordinates are latitude first, then longitude second (latitudes should range from 0 to 90; longitudes should range from 180 to -180)
var center = [1.3417977, 103.9636011]
// This defines the zoom level of the map when the page is first shown
var zoom = 17
Next, we just create L.tileLayer objects and add that to a L.map object (L stands for Leaflet.
// This actually adds the layer that we named above, as a tileLayer
var layers = layerIds.map(layerId => {
	return L.tileLayer('https://api.mapbox.com/styles/v1/mapbox/{style}/tiles/256/{z}/{x}/{y}?access_token={apiKey}',
		{
			maxZoom: 20, // maximum zoom
			attribution: attribution,
			apiKey: apiKey,
			style: layerId,
		}
	)
})

// Here we create the map
// - we give it the layers
// - we tell it the center location
// - we decide how much to zoom-in
var map = L.map('map', {layers: layers}).setView(
	center=center,
	zoom=zoom,
);
The interactive map below should be displayed when you are done! You can also just open 1-basic.html from the Github repo here.
You can try adjusting any of the variables mentioned above to customize the map that is displayed. Try changing the layer from satellite-streets-v10 to dark-v9 or light-v9!
Add Multiple Layers
This will follow the 2-layers.html file in the Github repository. Source code here and sample page here
Adding multiple layers is really easy with Leaflet!
First we add another layer light-v9 to the list of layerIds from earlier. Then, we create another list of layerNames to store the names of these layers that will show up in our interactive controls.
var layerIds = [
	'satellite-streets-v10',
	'light-v9',
]
var layerNames = [
	'Satellite',
	'Streets',
]
Then add in some additional commands after the last line that creates our map, which will create the control menu.
var baseMaps = {}
layers.map((layer, i) => {
	baseMaps[layerNames[i]] = layers[i]
})
L.control.layers(baseMaps).addTo(map);
TADA that’s all!
Notice in the above map that the names of the layers in the control menu corresponds to the names we set in the layerNames list.
Add Custom Shapes
This will follow the 3-geojson.html file in the Github repository. Source code here and sample page here
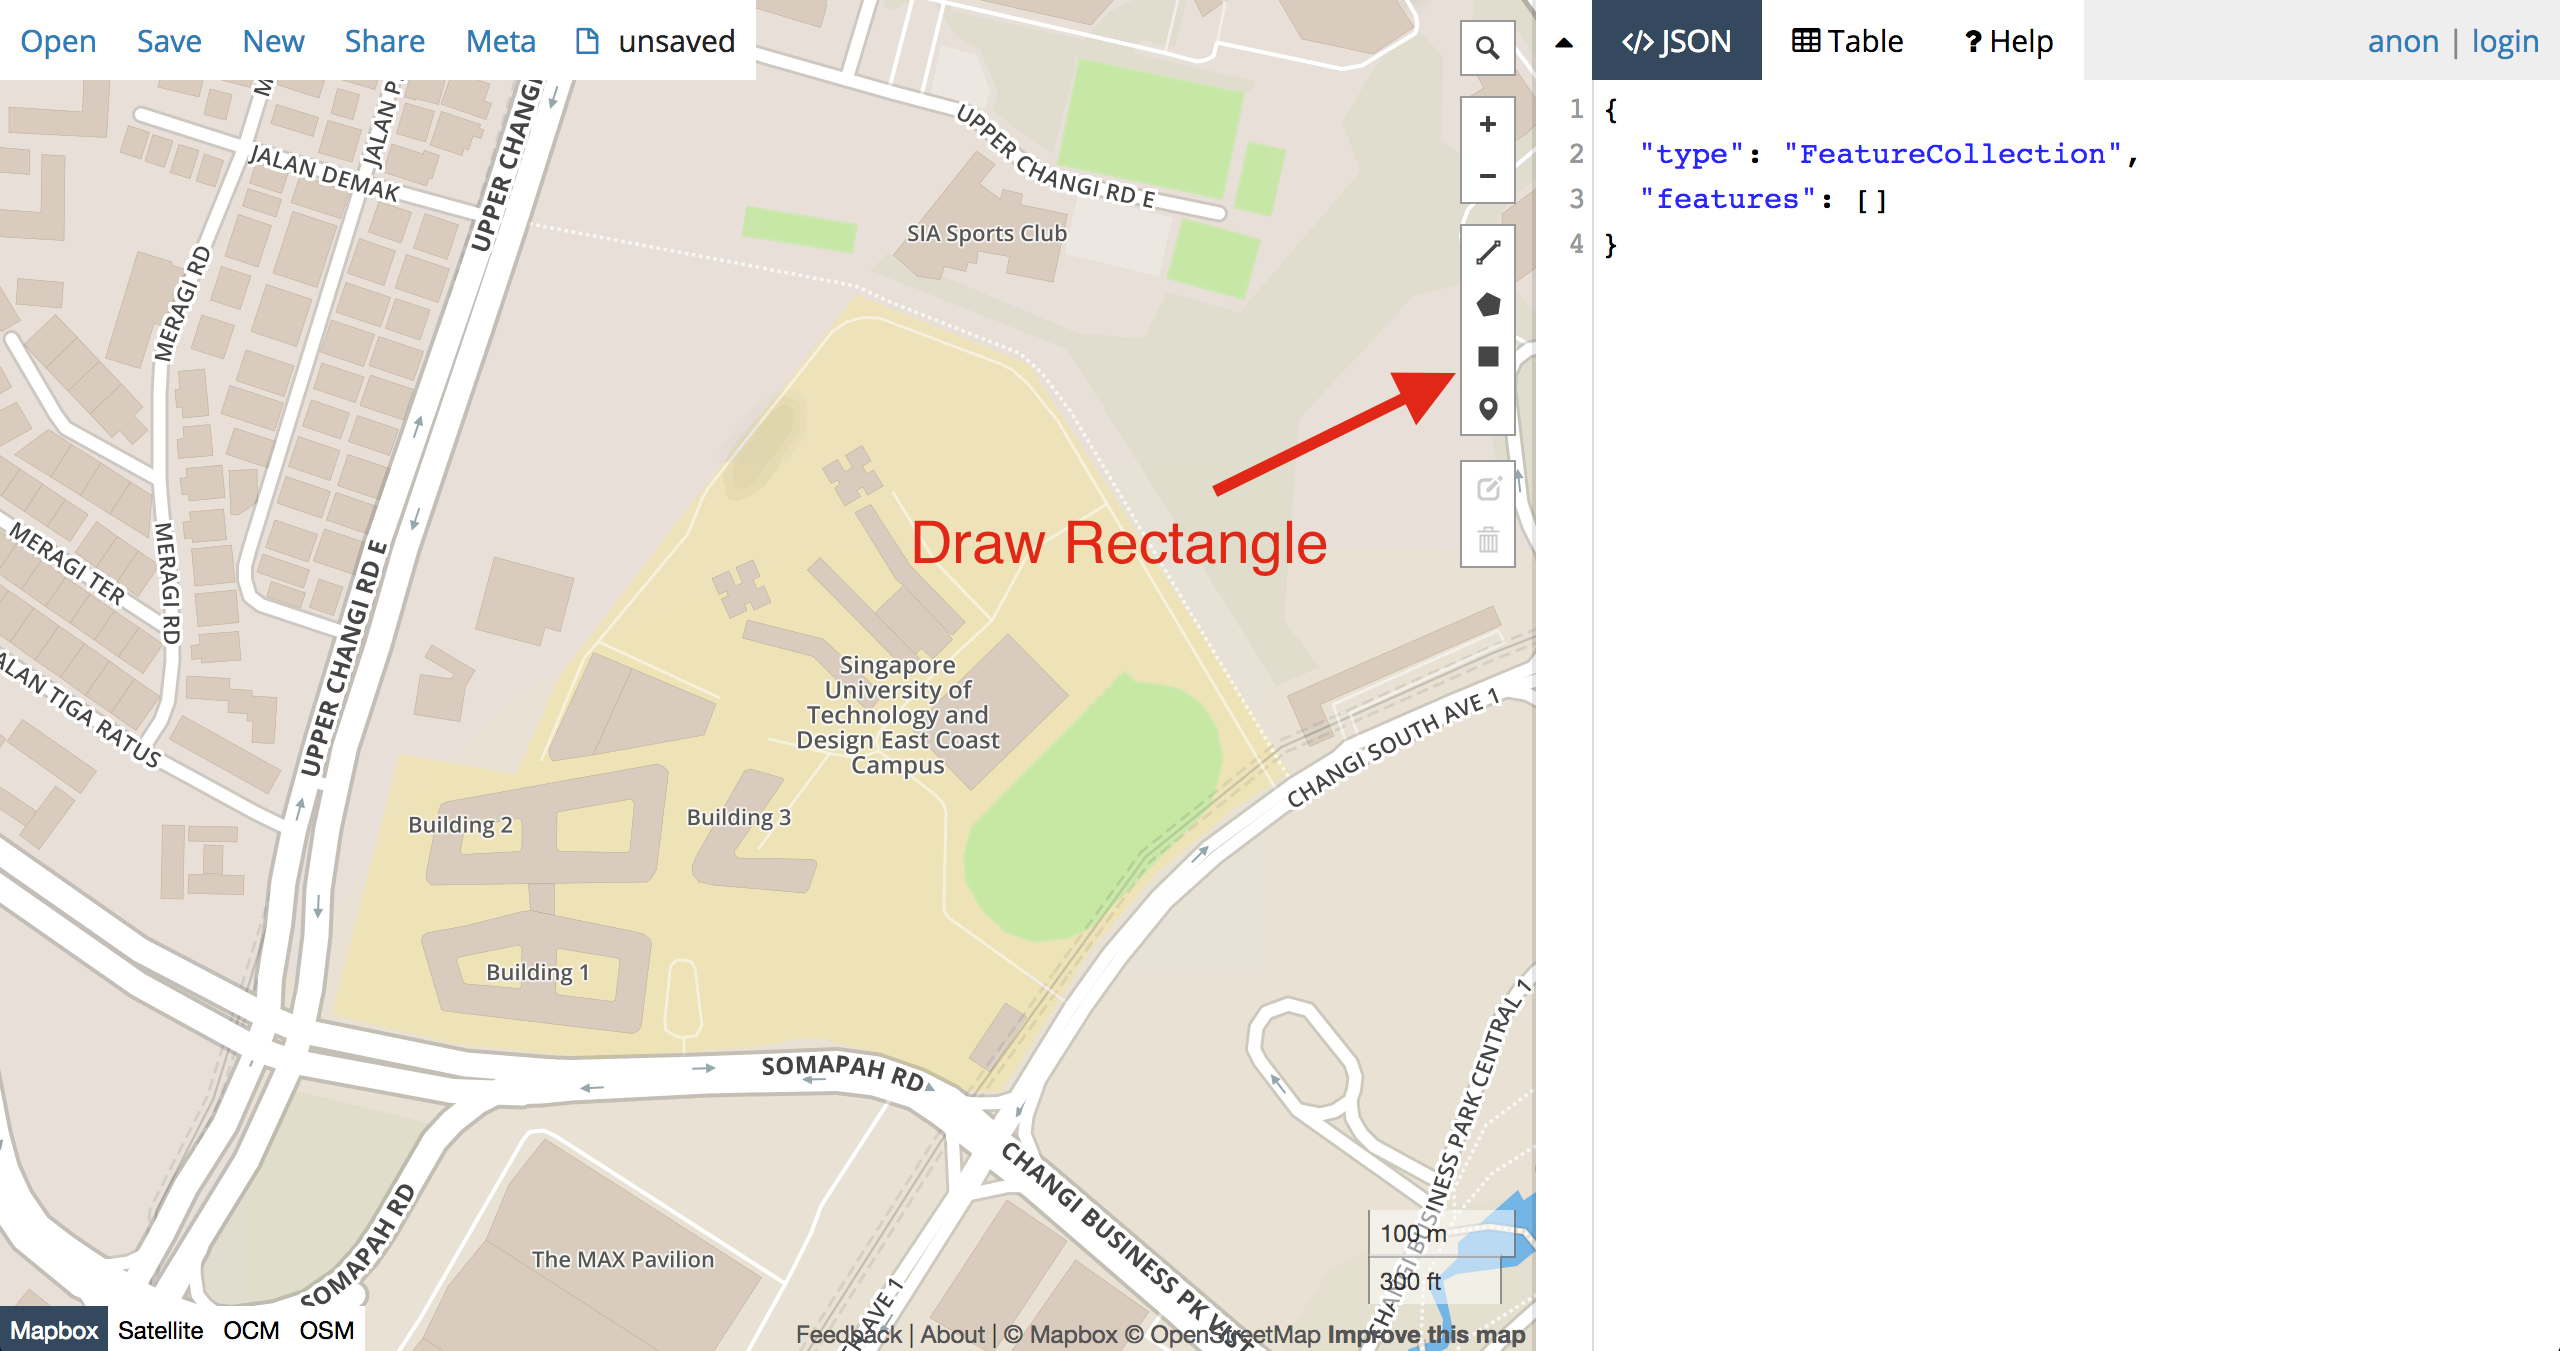
One new thing we will be introducing here is the web app at http://geojson.io. This helps to export any drawings on the map to a geojson format that is readable by Leaflet.
For starters, we can try drawing a rectangle near SUTD.
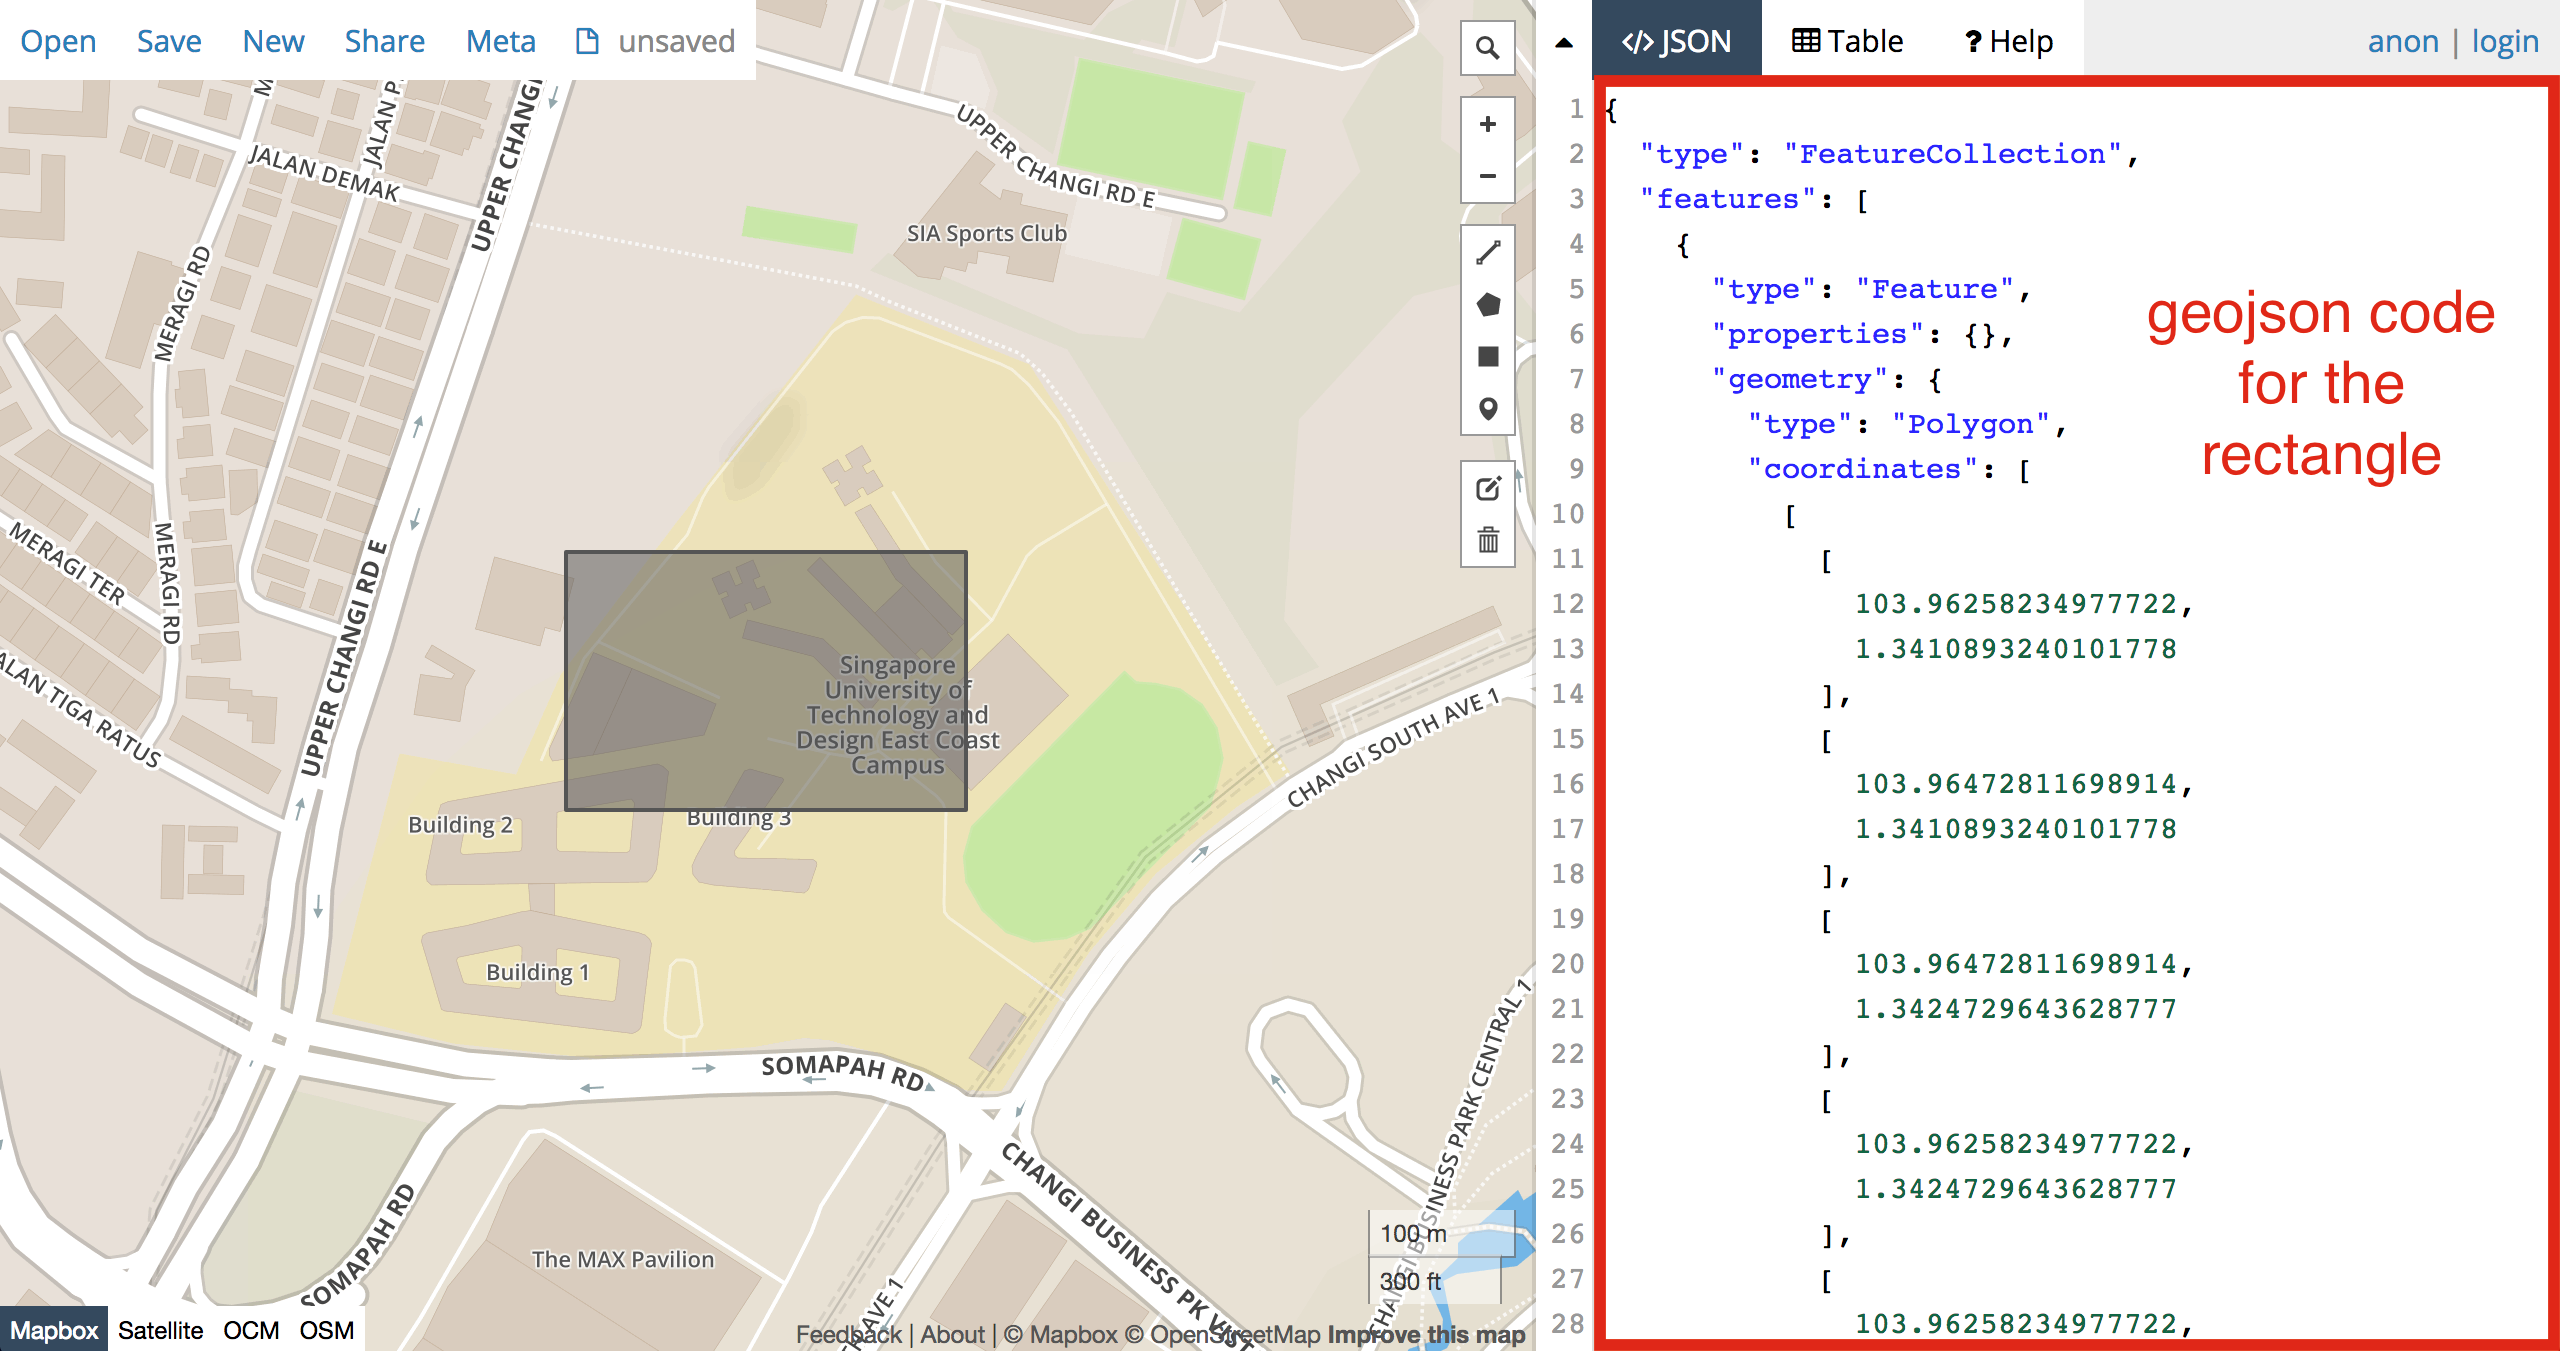
Then just copy the code on the right side and paste into our html file, prepending it with var rectangle = . See below for an example. See 3-geojson.html in the repository for a clearer example.
var rectangle = {
	"type": "FeatureCollection",
	"features": [
		{
			"type": "Feature",
			"properties": {},
			"geometry": {
				"type": "Polygon",
				"coordinates": [
					[
						[
							103.96244287490845,
							1.3407729100211627
						],
						[
							103.9633923768997,
							1.3407729100211627
						],
						[
							103.9633923768997,
							1.3413145678418545
						],
						[
							103.96244287490845,
							1.3413145678418545
						],
						[
							103.96244287490845,
							1.3407729100211627
						]
					]
				]
			}
		}
	]
}
Then we just need to add the following one-liner to add the geojson rectangle to our map.
var geojson = L.geoJson(rectangle).addTo(map)You can also customize the color and other properties of the geojson shape by adding additional parameters when initializing the L.geoJson object.
var params = {
	style: {
		weight: 5, // border thickness
		opacity: 1, // border opacity
		color: '#ffffff', // border color
		fillOpacity: 0.5, // fill opacity
		fillColor: '#0000ff' // fill color
	}
}
var geojson = L.geoJson(rectangle, params).addTo(map)
Hover and Highlight Shapes
This will follow the 4-highlight.html file in the Github repository. Source code here and sample page here
To make the map feel more interactive, we can make a shape respond when the mouse hovers over it.
In the below code, the part where the shape responds is in the highlightFeature function. Here, we simply increase the border weight to 10 and increase the fillOpacity to 1.
// Placeholder for L.geoJson object
var geojson;
// Function to highlight the object when the mouse hovers over the shape
function highlightFeature(e) {
	var layer = e.target;
	layer.setStyle({
		weight: 10, // Increase border weight to 10
		fillOpacity: 1, // Increase fill opacity to 1
	});
}
// Function to reset the highlight when the mouse moves away from the shape
function resetHighlight(e) {
	var layer = e.target;
	geojson.resetStyle(e.target);
}
// Applying the two functions above
function onEachFeature(feature, layer) {
	layer.on({
		mouseover: highlightFeature,
		mouseout: resetHighlight,
	});
}
// Adding the functions above to the parameters
var params = {
	style: {
		weight: 5,
		opacity: 1,
		color: '#ff0000',
		dashArray: '0',
		fillOpacity: 0.5,
		fillColor: '#0000ff',
	},
	onEachFeature: onEachFeature,
};
geojson = L.geoJson(rectangle, params).addTo(map);
Infobox
This will follow the 5-infobox.html file in the Github repository. Source code here and sample page here
We can also add an infobox at the bottom of the map, which changes content when the user hovers over specific shapes.
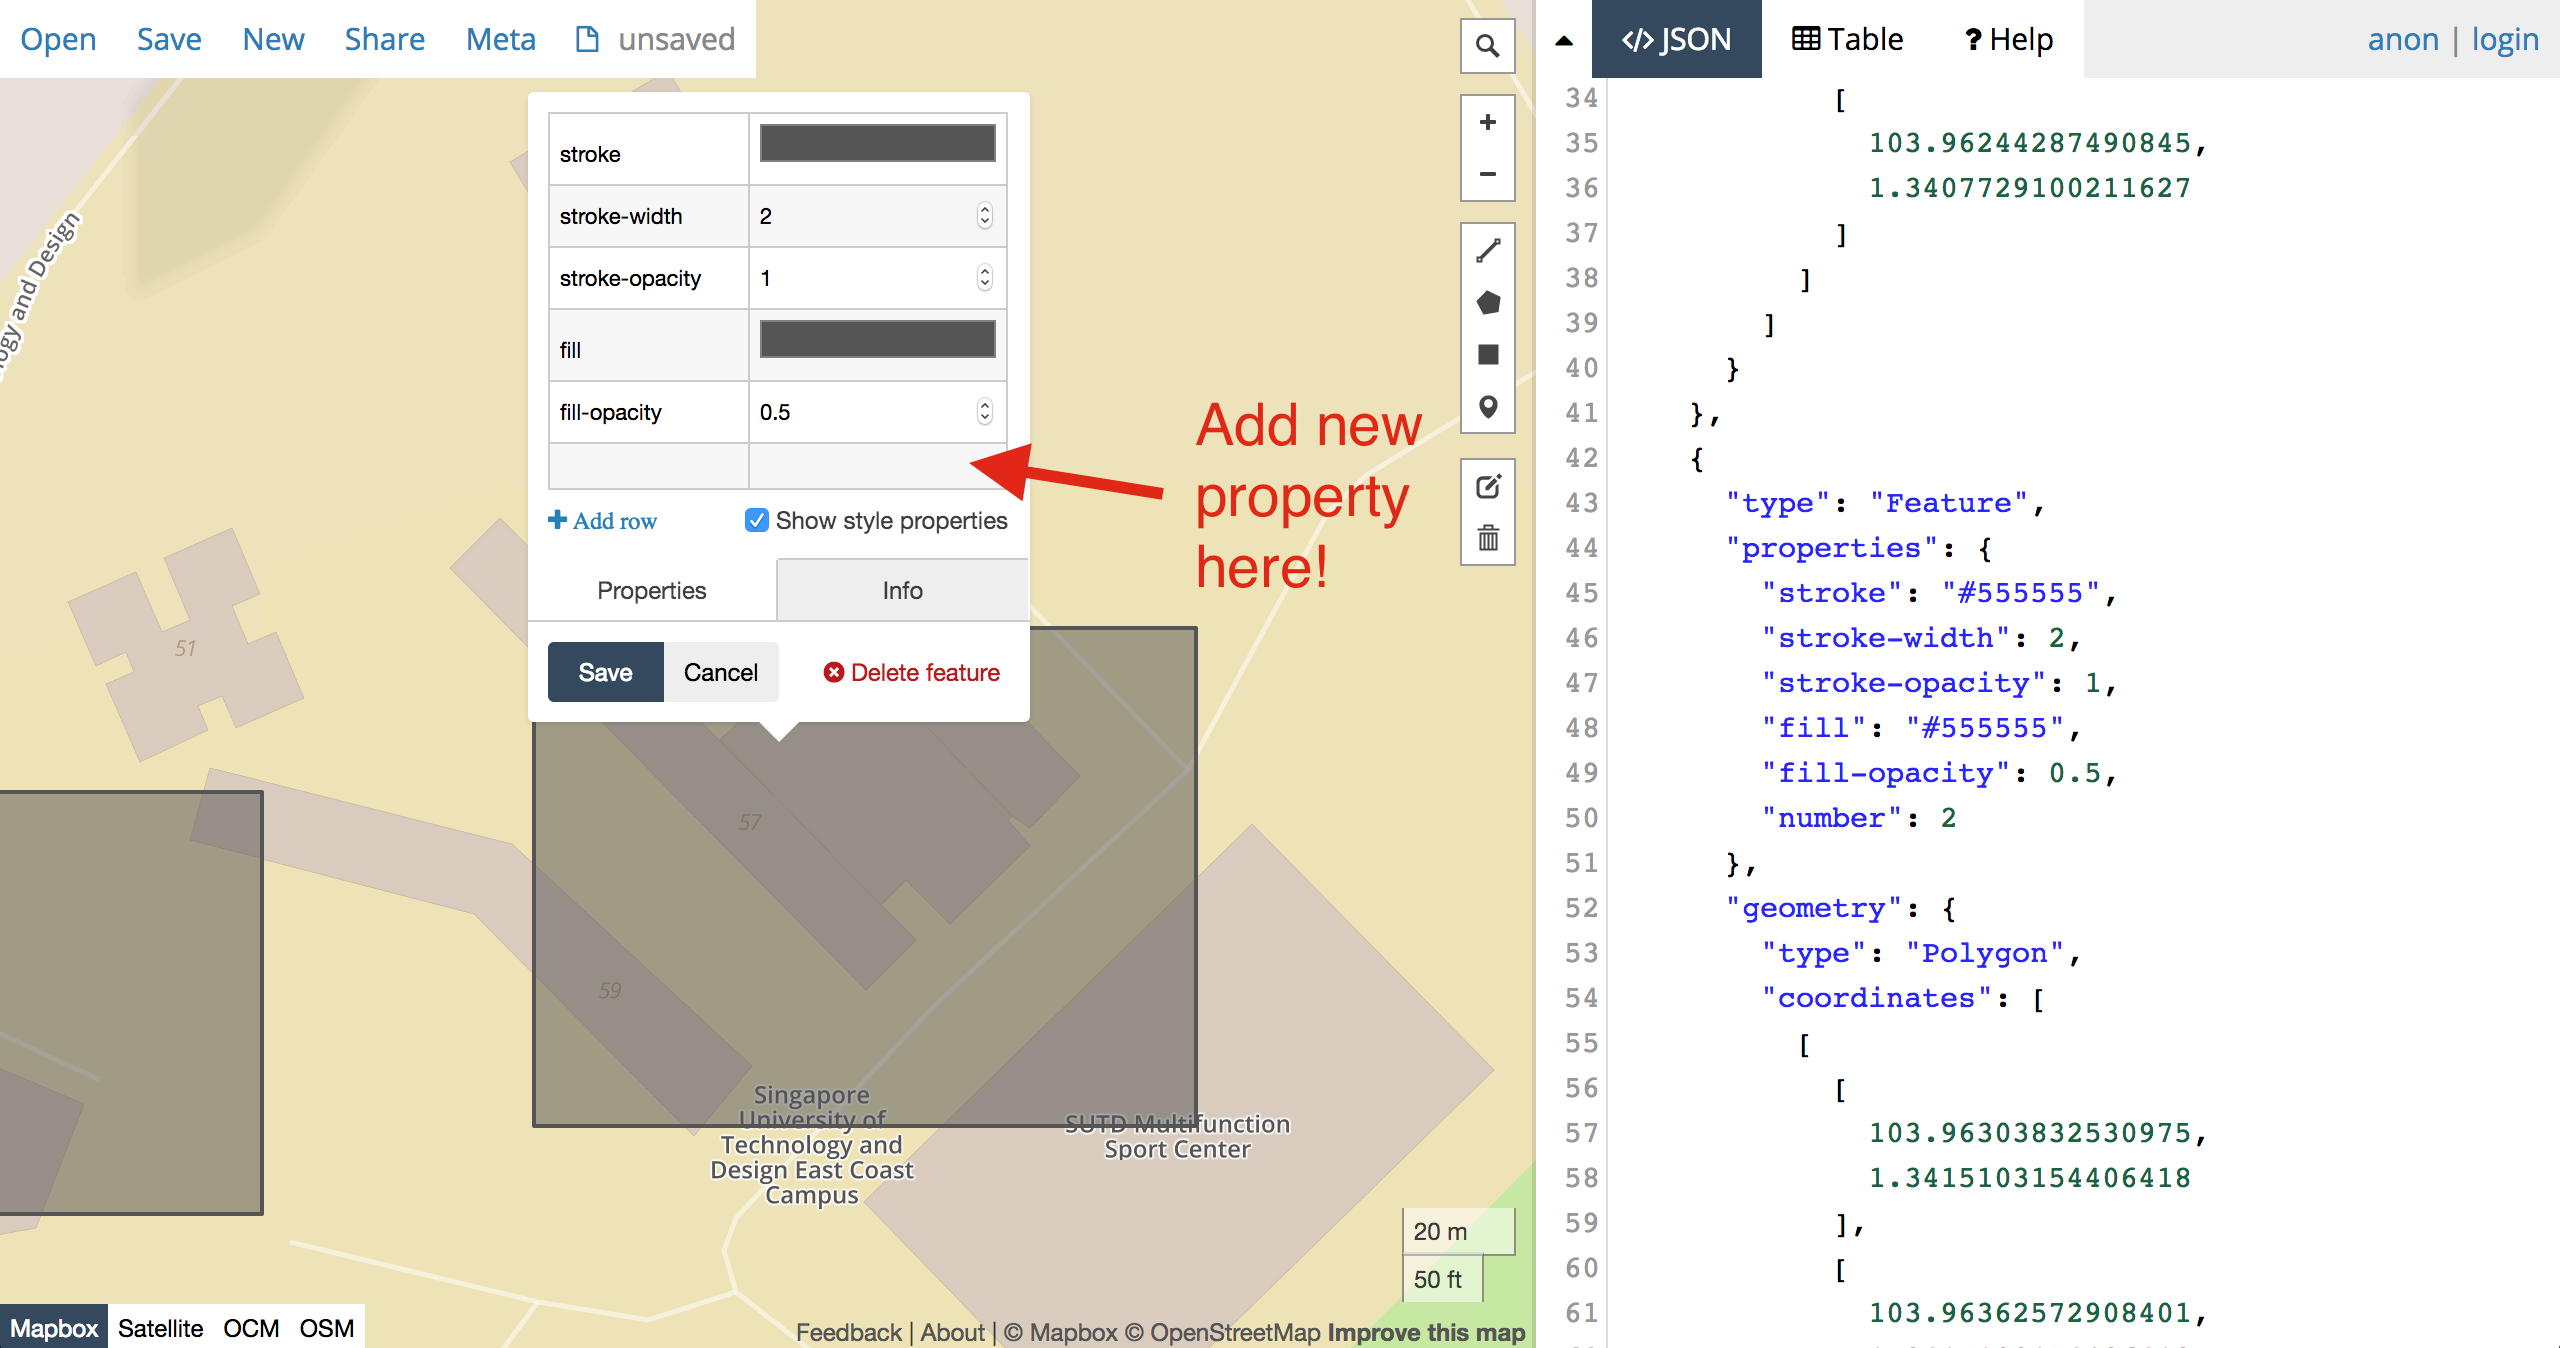
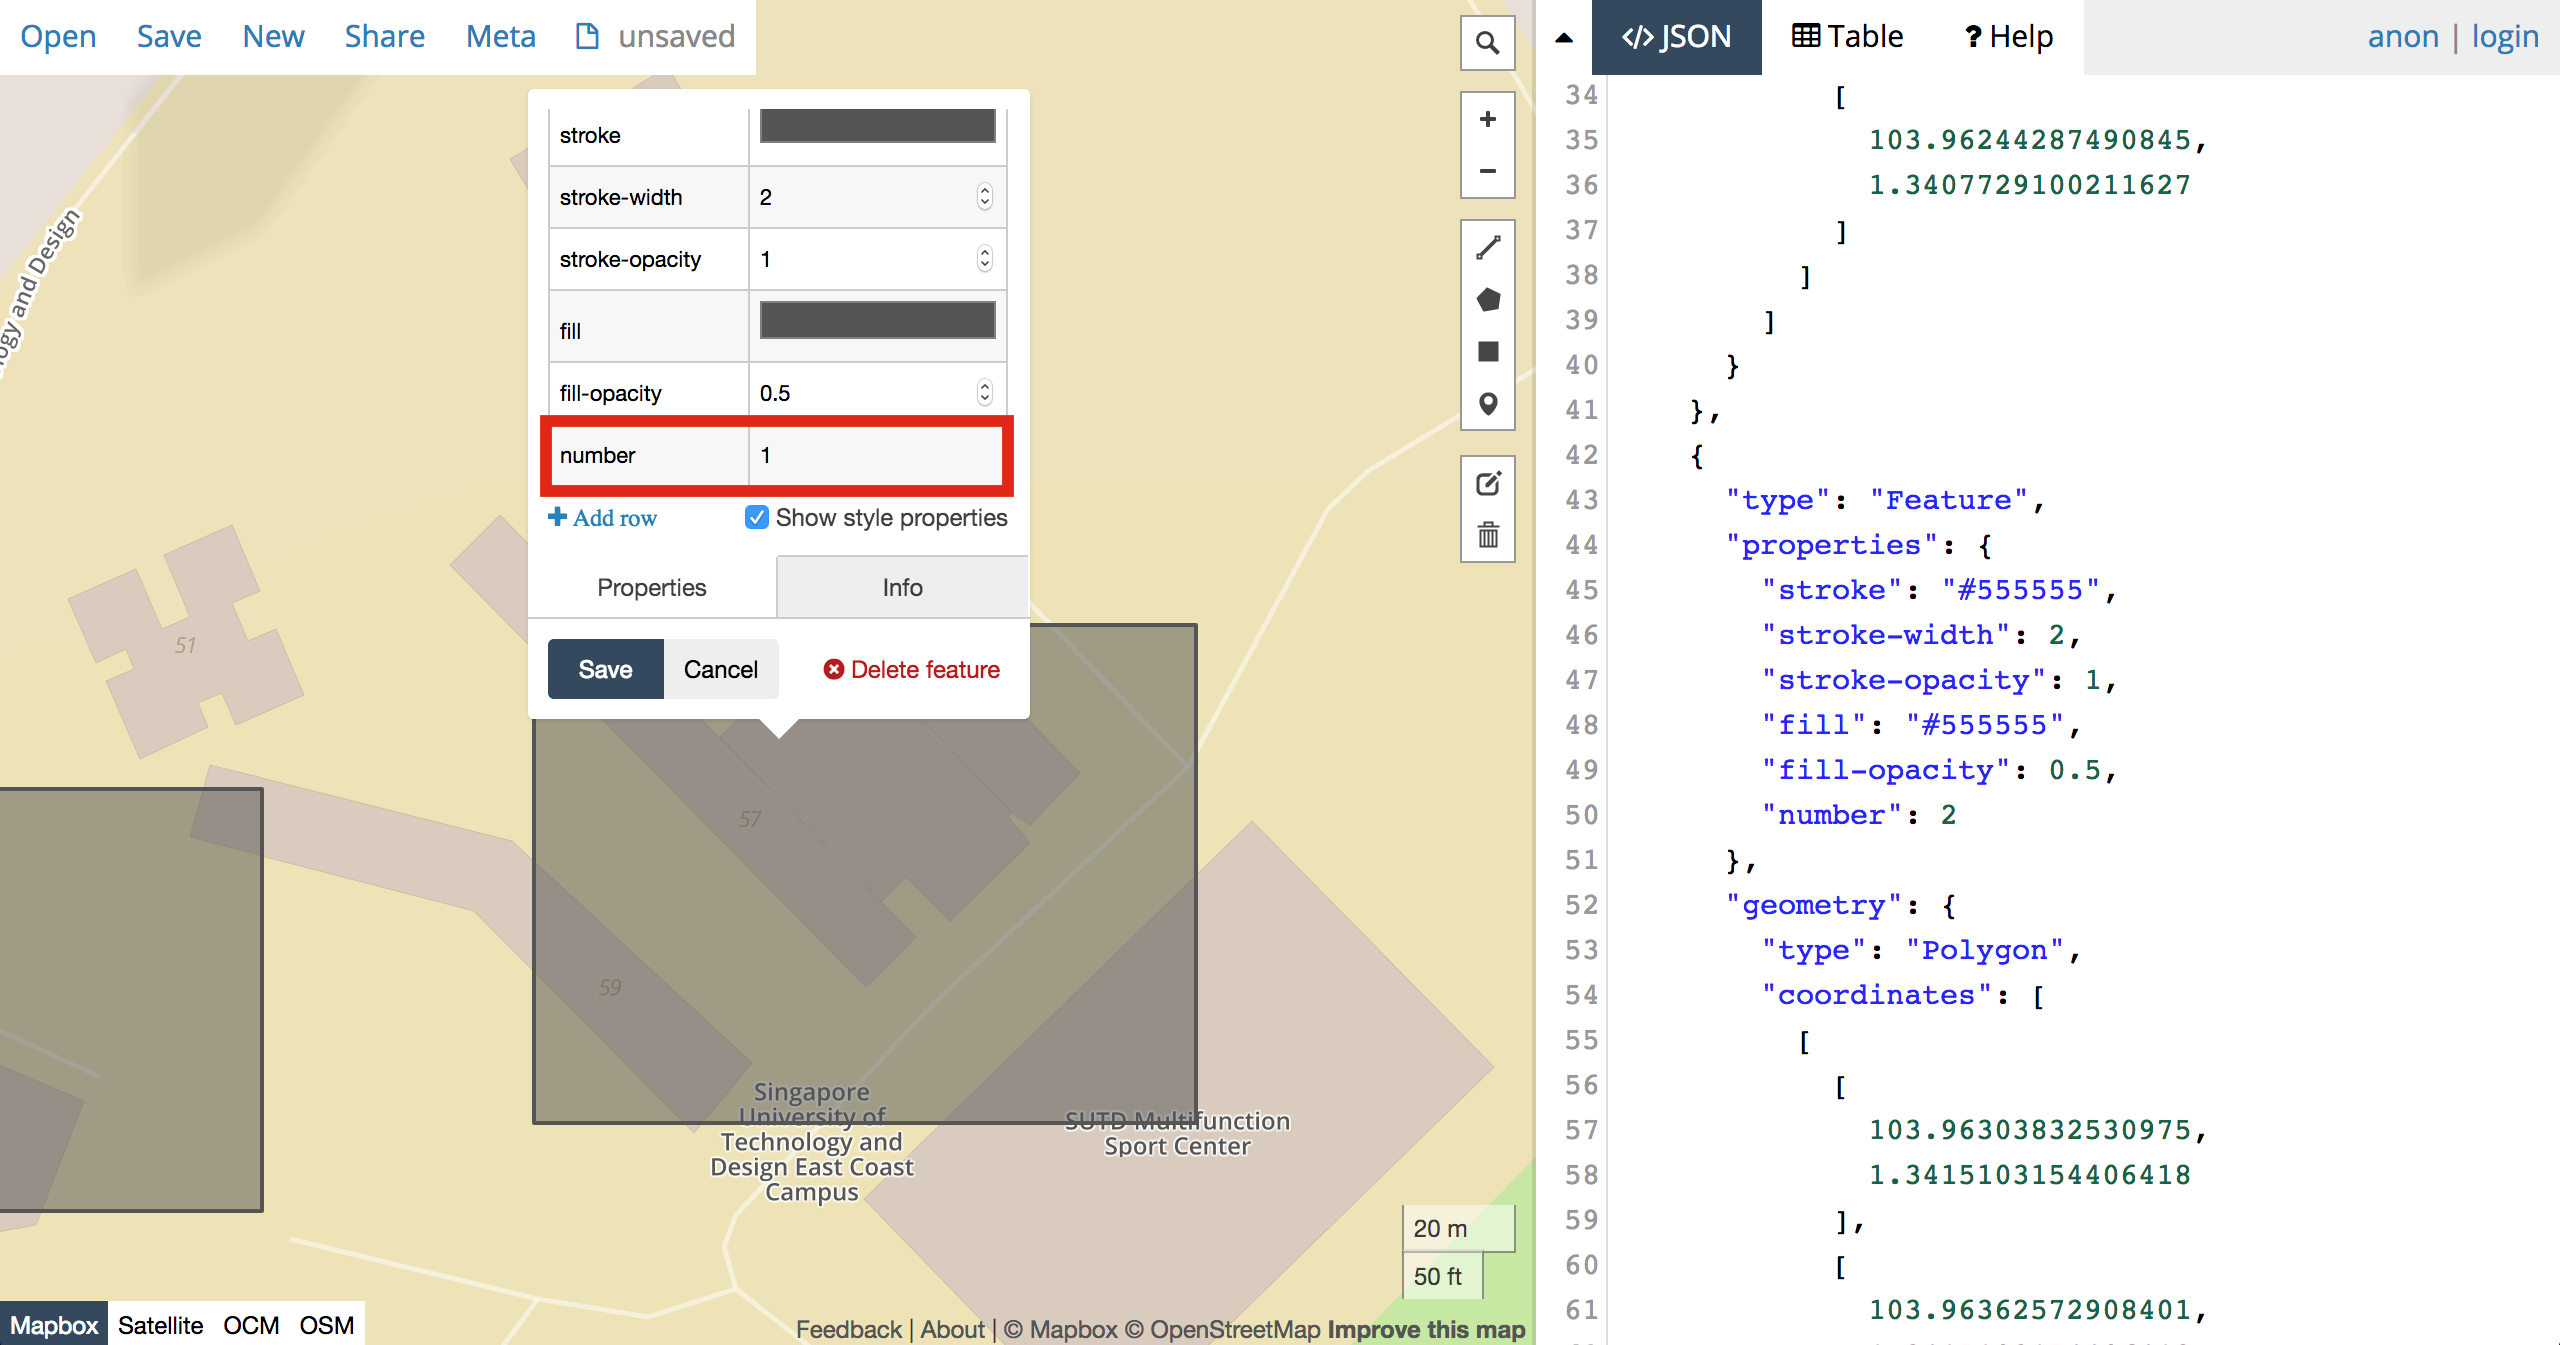
In order to illustrate this more effectively, let’s add another rectangle using http://geojson.io. In addition, click on the original rectangle and add a new row in the Properties tab, named number with value 1. Do the same for the new rectangle but with value 2. See below for an example.
Next just copy the geojson code over as per before, prepending it with var rectangle = , using it to replace the previous geojson code.
Then add in the following lines of code to add the infobox in the bottom right corner of the map.
Add this to the CSS:
.infobox {
	padding: 8px;
	box-shadow: 0 0 15px rgba(0,0,0,0.2);
	border-radius: 8px;
	font-size: 18px;
}
And this to the end of the Javascript:
var infobox = L.control({
	position: 'bottomright',
});
infobox.onAdd = function (map) {
	return L.DomUtil.create('div', 'infobox');
};
infobox.addTo(map);
Finally, we just need to amend the highlightFeature function to get the map to update the infobox when we hover over the shape. Recall that this function is called whenever we hover over a shape.
We update the HTML of the infobox using the number property that we added into the geojson earlier, which we access using layer.feature.properties.number.
function highlightFeature(e) {
	var layer = e.target;
	layer.setStyle({
		weight: 10,
		fillOpacity: 1,
	});
	// New lines below
	// We get the `infobox` element and then update the HTML inside the element using the shape's `number` property that we defined earlier.
	var infobox = document.getElementsByClassName('infobox')[0]
	infobox.innerHTML = '<b>Shape No.</b></br>'
	infobox.innerHTML += layer.feature.properties.number
}
Then we should have something that looks like the map below! Hovering over the two shapes should change the infobox content.
This also means that you can change what the infobox says by editing the infobox.innerHTML part in the code above.
In addition, you can assign and access different properties of each shape (such as different types of buildings) using the geojson.io webapp, by changing the number property to something else, say buildingType, which will be accessed by layer.feature.properties.buildingType in the code.
That’s it for the tutorial! Hope it helped!
Bonus!
If you did sign up for a Mapbox account, you will also have access to Mapbox Studio, which allows you to create your own map styles and also browse a gallery of gorgeous styles. Check out some examples below!
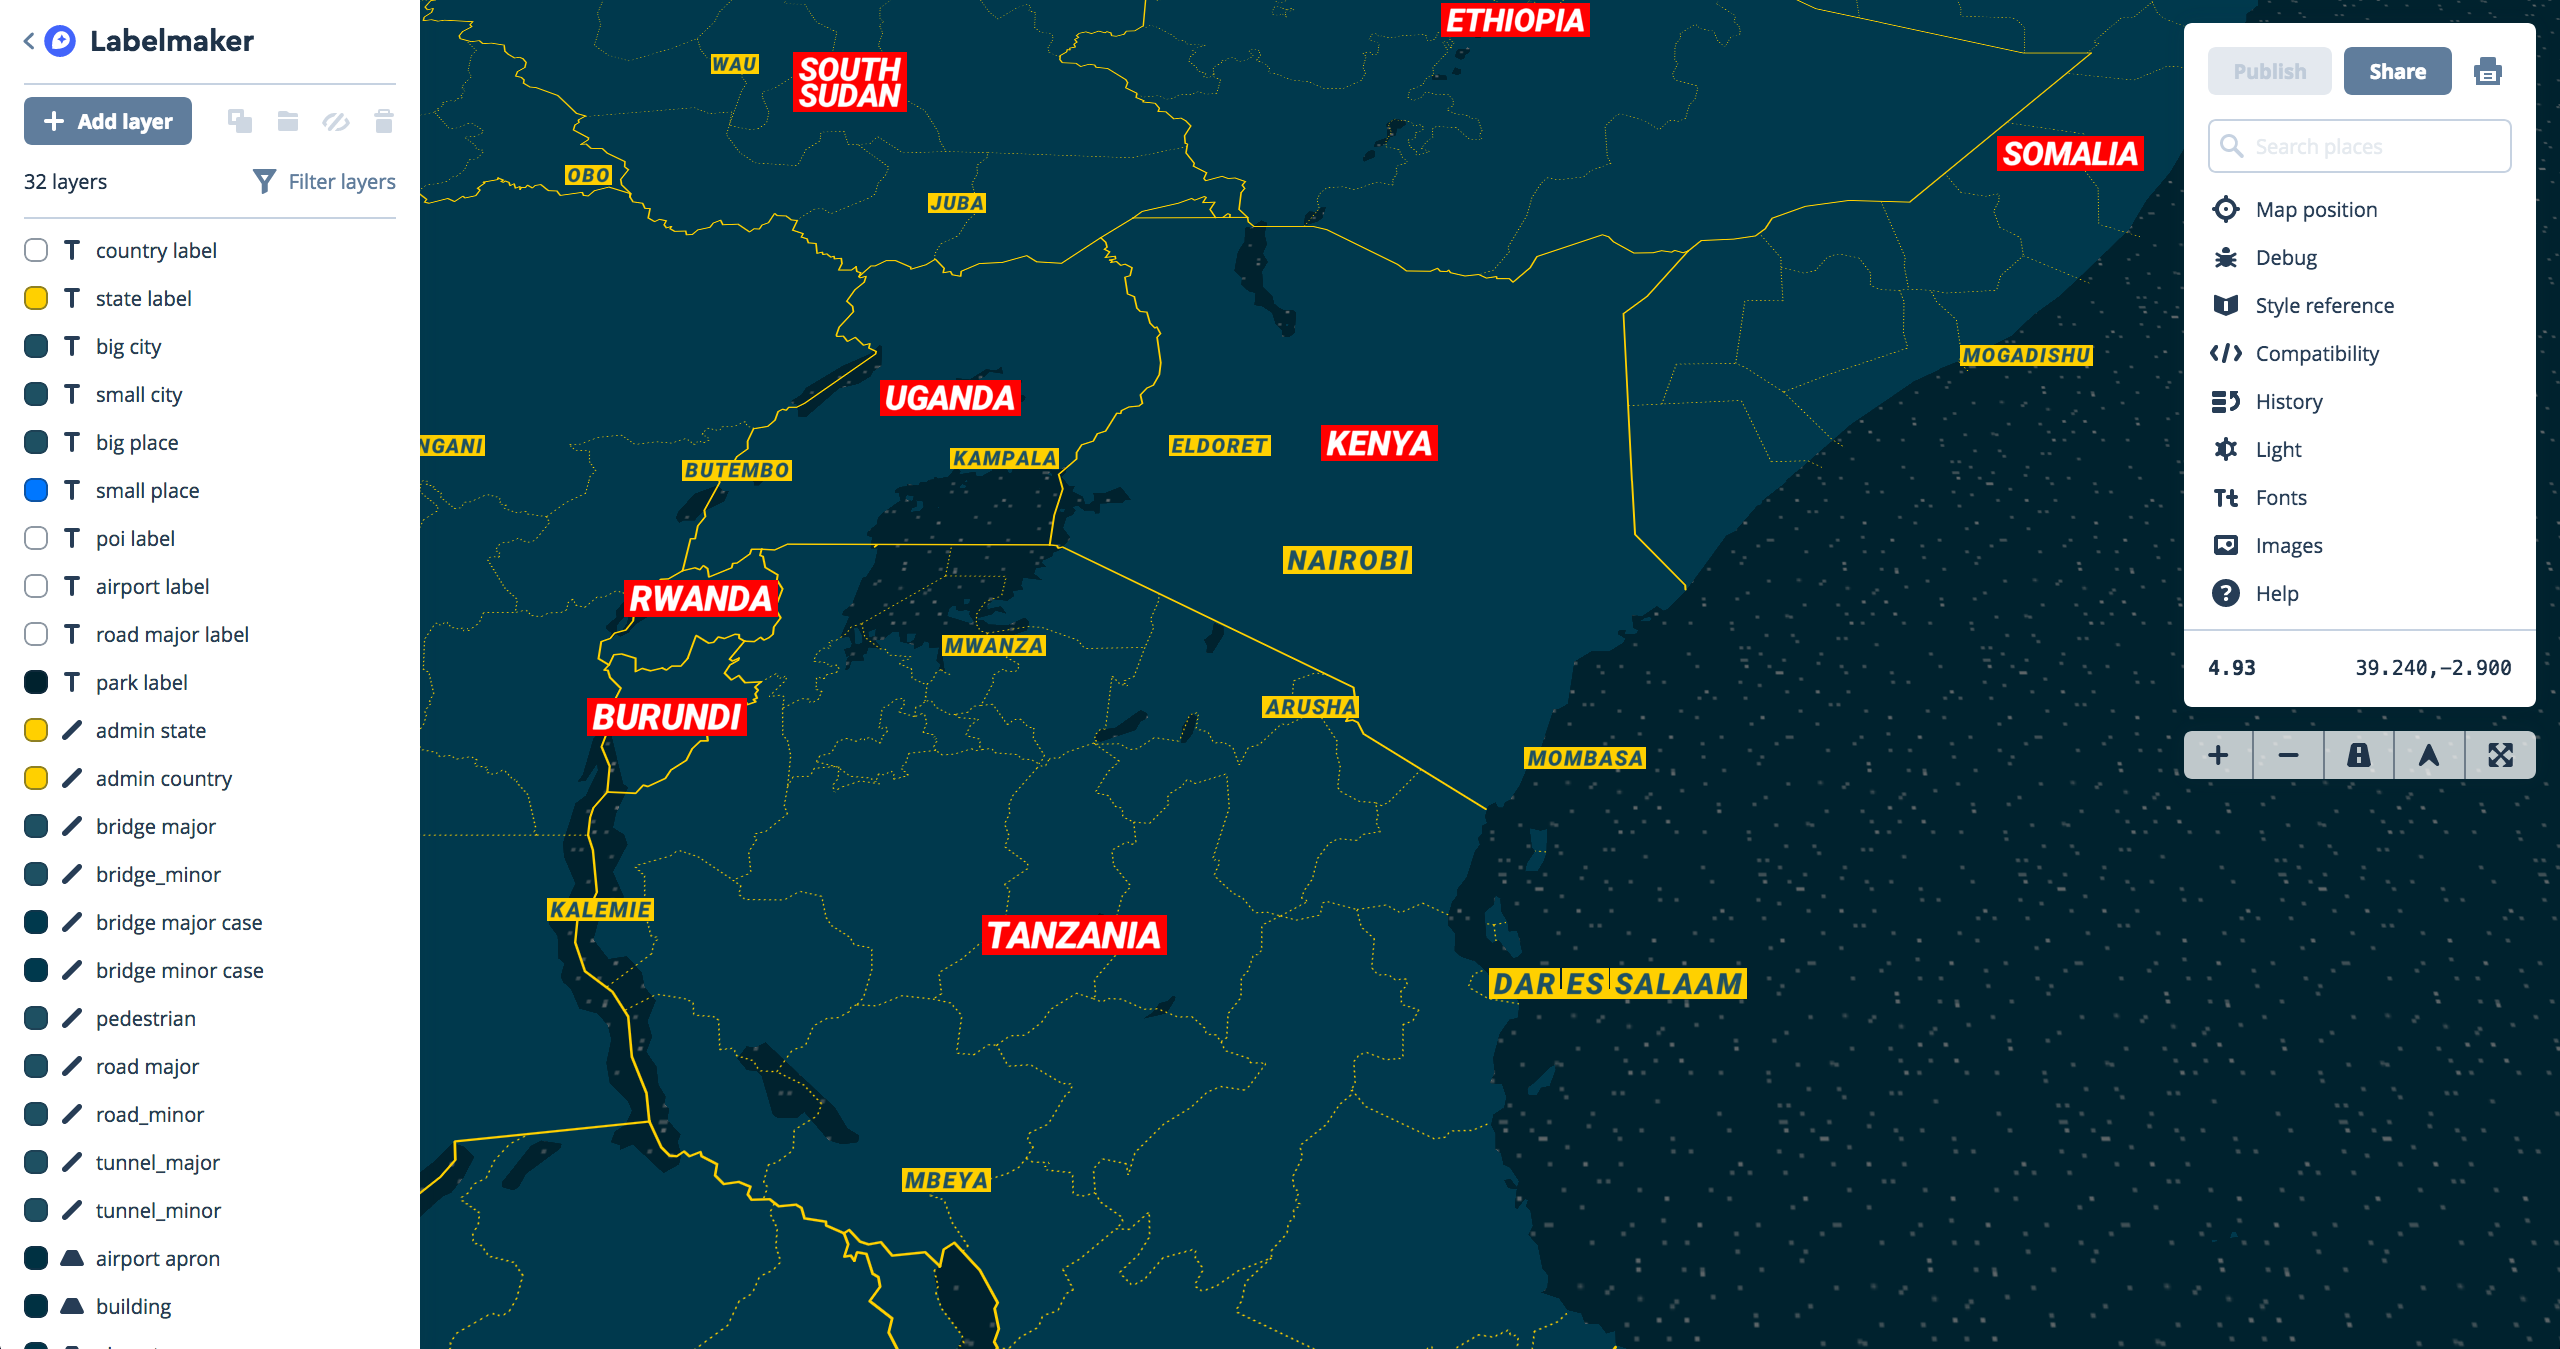
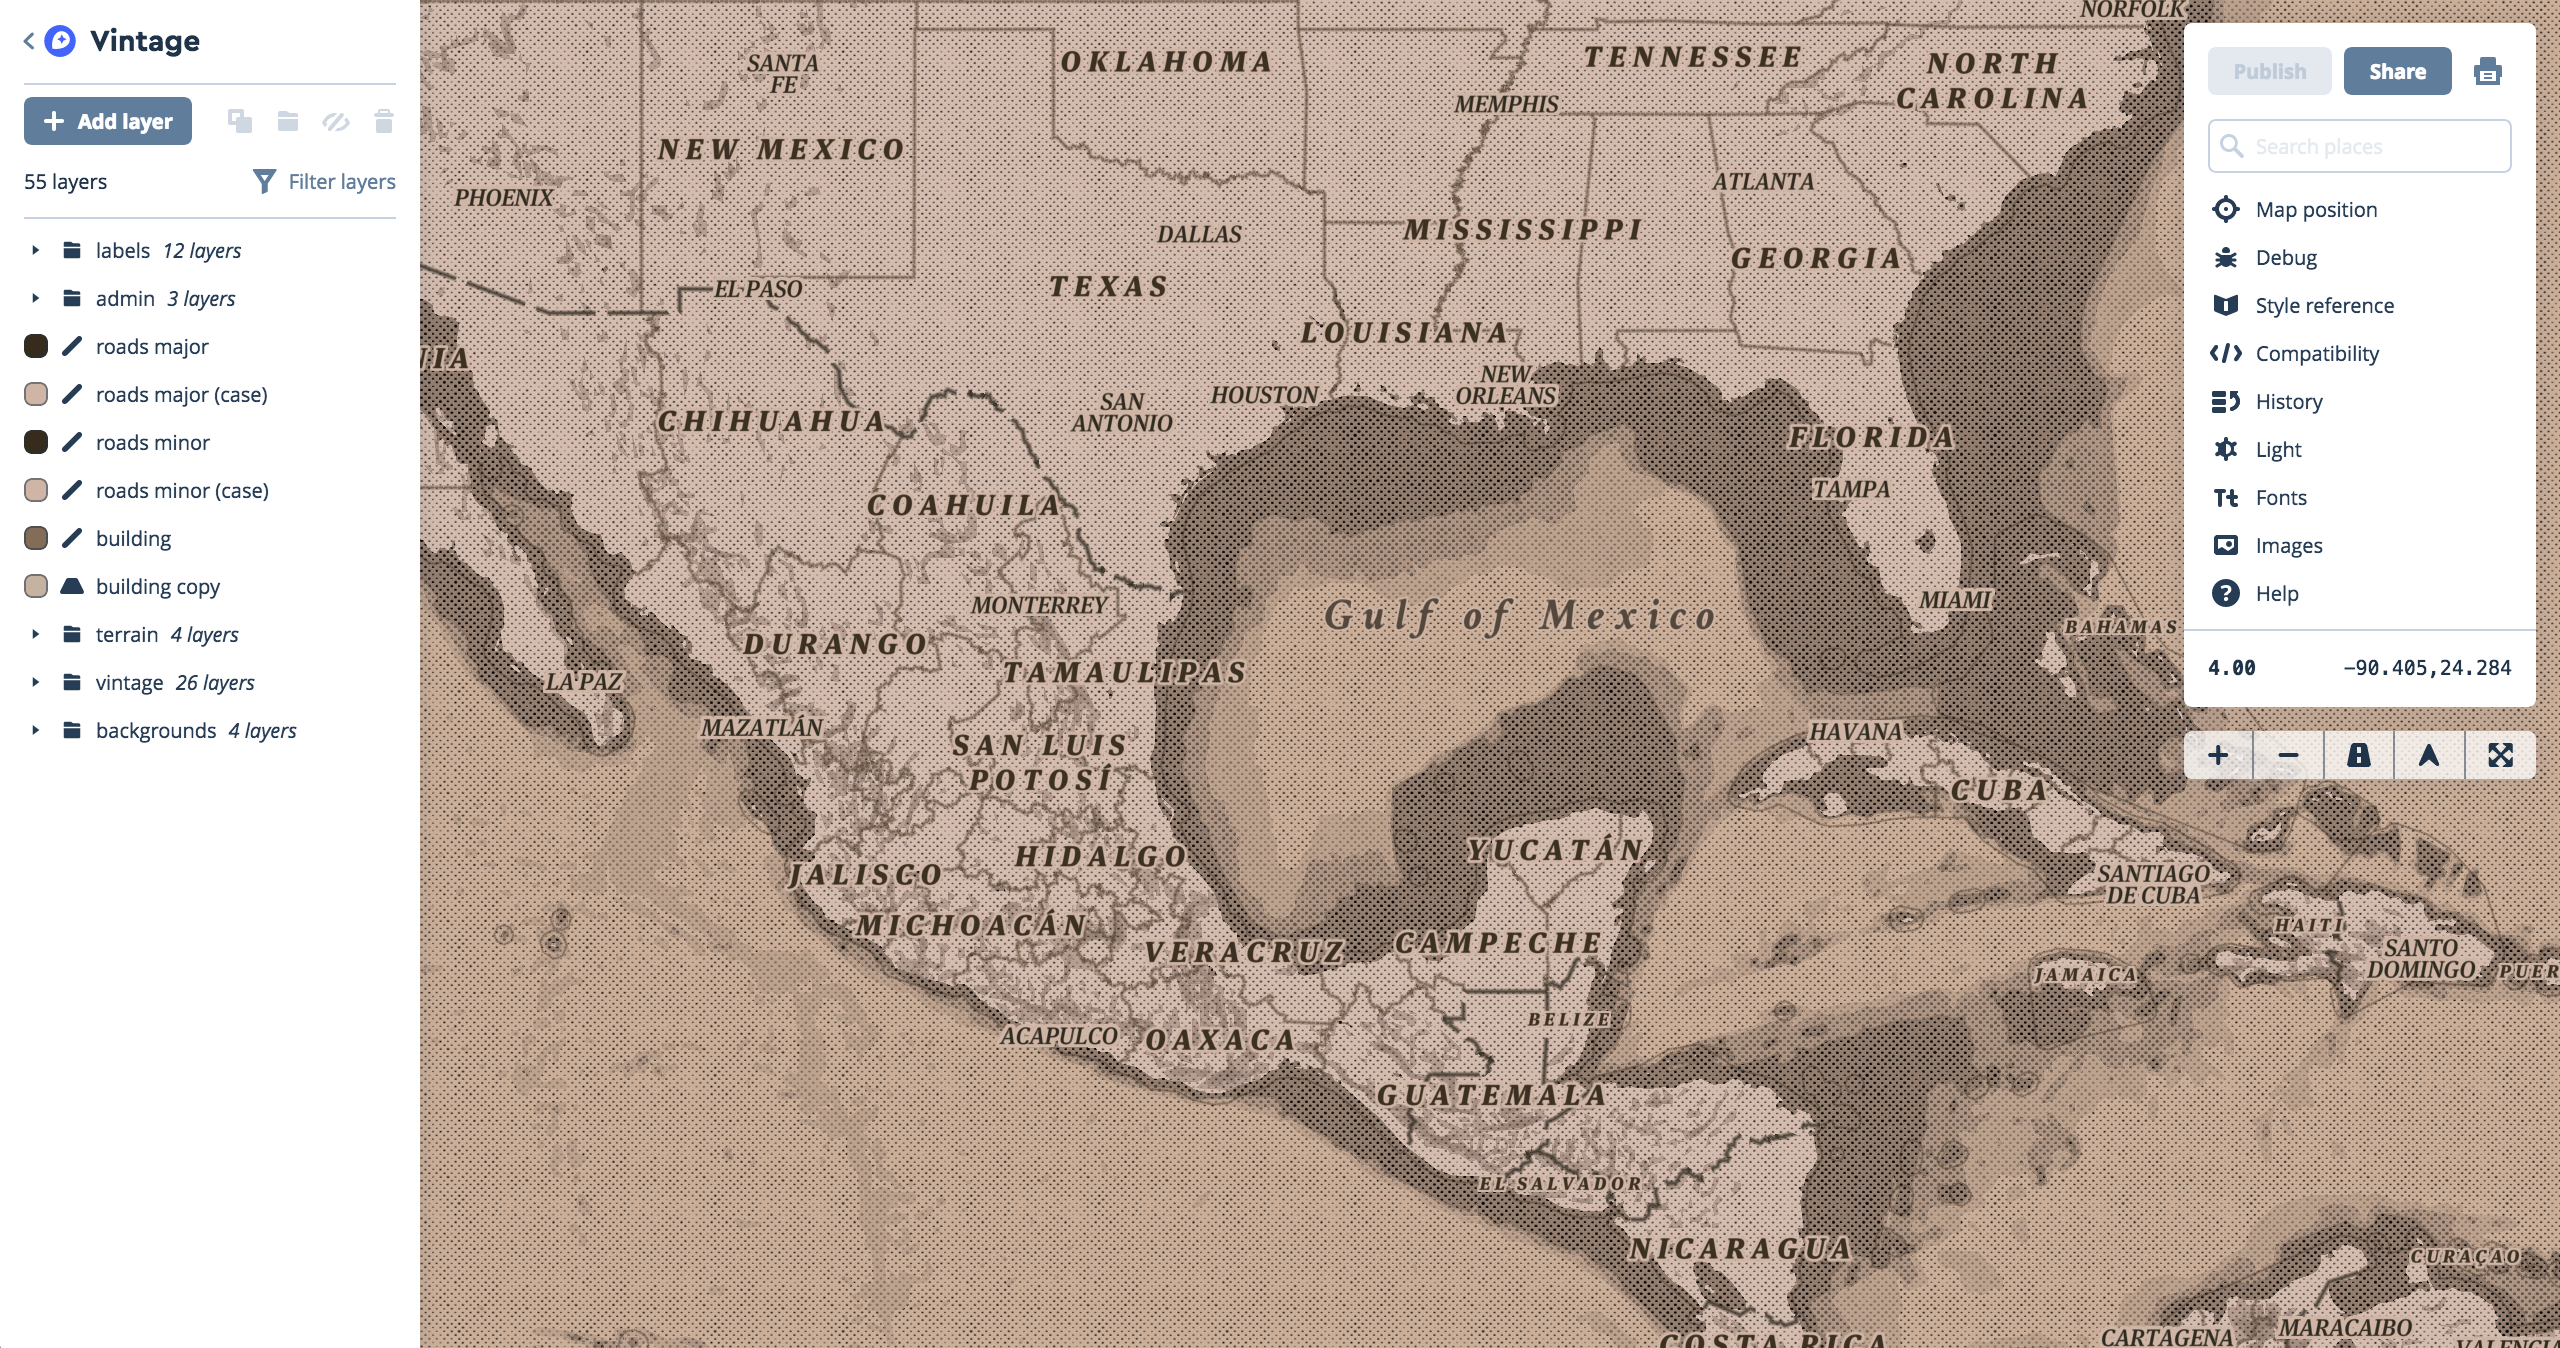
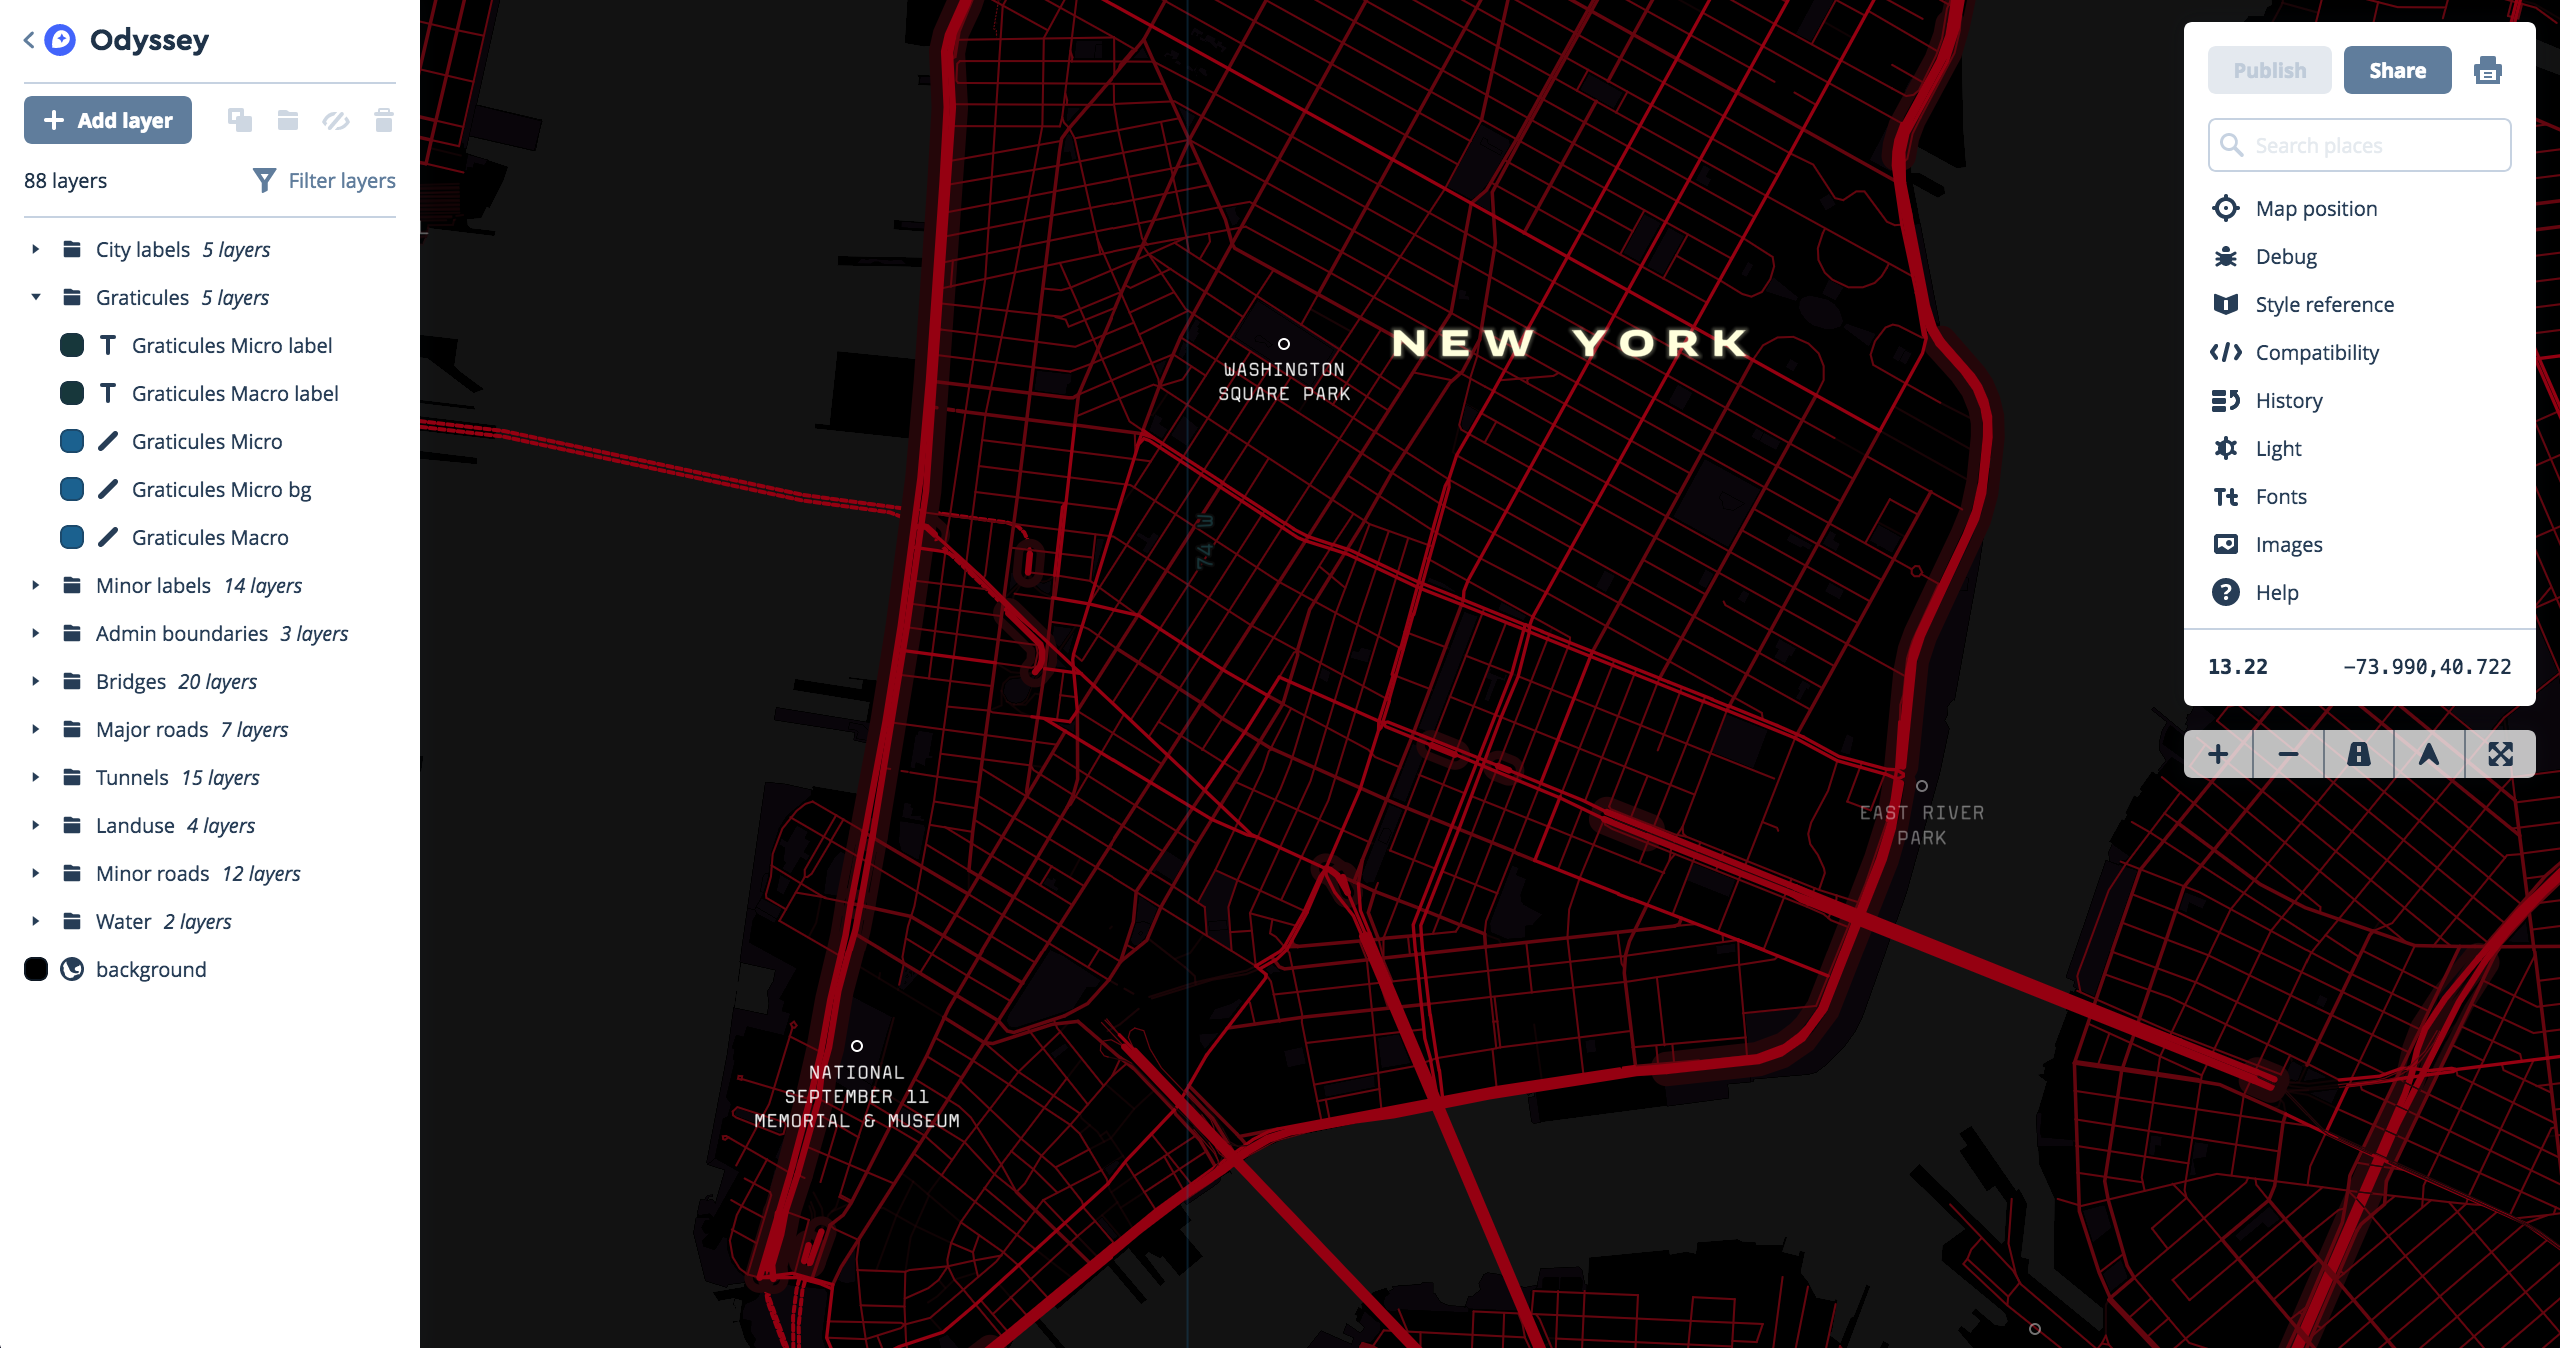
More on this next time!